FOOD FOR THOUGHT
FIGHTING HUNGER WITH DATA
HOW ANALYTICS HELPED HUNGER FREE AMERICA SHOW THE IMPACT OF THE SOCIAL SAFETY NET ON FOOD INSECURITY
In April 2020, near the beginning of the pandemic, a photo went viral: thousands of cars lined up at a San Antonio food bank. The image led to millions of dollars in donations to the food bank.
At that same moment, 294,512 residents of Bexar County – where San Antonio is located – were much less visibly overcoming hunger through $34 million in Supplemental Nutrition Assistance Program benefits (formerly known as “food stamps”) paid for by the federal government.
Hunger Free America is a nonpartisan nonprofit group working to enact the policies and programs needed to end domestic hunger – like those government benefits – and eliminate reliance on charity to fight food insecurity.
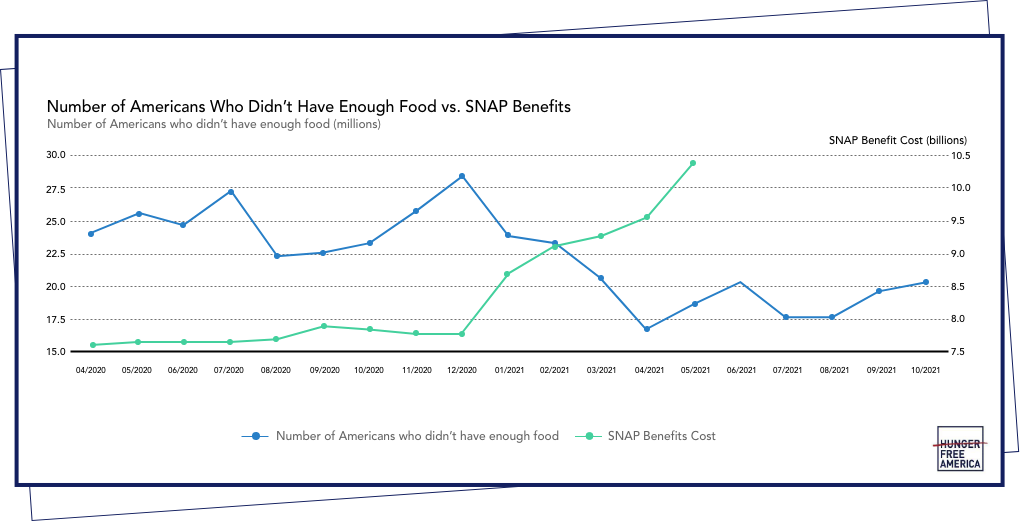
What it needed was an image that grabbed attention the way those rows of cars at the food bank did. They found it in visualized rows of data.


Joel Berg, CEO of Hunger Free America

TAKING THE PULSE ON HUNGER
Hunger Free America, working with a team of analytics volunteers at SAS, began analyzing data over time from the US Census Bureau’s Household Pulse Survey, in which respondents report biweekly on food insecurity during the pandemic.
Combining that information with data on the benefits paid out directly through a variety of social safety net programs – SNAP, school breakfast/lunch, and child and adult care programs – allowed Hunger Free America to explore associations it hoped would support its goal of helping society move “beyond the soup kitchen” and ensure economic and food self-sufficiency for all Americans.
“The challenge was there was this new source of data – the pulse survey – which had never been done on a regular basis, and the first step was to figure out how to pull it all together,” says enterprise data engineer Stephan Weigandt, who was part of the SAS volunteer team. “And the next was to automate that process so the analysis would always be using the most current data. It was definitely an iterative process.”
Being able to aggregate, analyze and visualize these large amounts of disparate data allowed Hunger Free America to visually back up its belief in the importance of the social safety net. The data showed that after employment and wages, the variables with the strongest relationship to food insecurity in the US were government nutrition-assistance programs.
The correlation might sound obvious: More funds and more food equal less hunger. But stating the obvious visually – especially backed by data – has potentially huge value in Hunger Free America’s efforts to show lawmakers the impact their decisions can have on hunger long-term.
“The timing for this is absolutely perfect to really impact these debates and impact public policy outcomes,” Berg says.
So why hadn’t Hunger Free America undertaken a data project like this before now to prove its belief that social safety net programs work? Simple: a lack of timely data.
Before the pandemic, the government would share a 12-month snapshot of households’ perception of their level of food security. And even that data, by the time it was published, was essentially out of date. The biweekly pulse survey results juxtaposed with the near-real-time cash payment data painted a much clearer picture.
“It is really critical to changing the national conversation,” Berg says.
THE REAL FACES OF HUNGER
While Hunger Free America’s data director, Angelica Gibson, was back in New York City digging into the visualization dashboards created using SAS® Visual Analytics, Berg embarked on a cross-country hunger-fighting tour.
The journey saw him drive more than 15,000 miles from coast to coast, visiting 37 states along the way. He saw firsthand what hunger looks like around the country in places like Oak Park, IL, an affluent Chicago suburb that nonetheless has significant pockets of poverty and residents regularly going hungry.
There, he spoke to a variety of people, including a fixed-income military veteran retiree who simply couldn’t afford food, a single father who saw his event-based business essentially shut down due to COVID-19, and someone who couldn’t work because of health problems. Visits like these had a big impact on him; the question was how to convey the story behind them more widely.
“We had a huge problem in America before the pandemic. The pandemic didn’t create it, it only made it worse,” Berg says. “The answer is to create more jobs, get people back to work, ensure that they get a living wage, and get people cash and food benefits. When we can combine the personal stories of people I met with the data, I think that’s the best melding of it.”
THE BEGINNING OF THE END?
Polling from Hunger Free America has shown that the majority of low-income Americans believe the US government could eliminate poverty, homelessness and hunger.
To spark conversation – and hopefully action – at the federal level, Berg has already shared the visualizations with his contacts at the White House and the Department of Agriculture.
The survey data also gives Hunger Free America the ability to drill down beyond the national level to look at state data. This means they can reach out to an even broader audience – including state and local governments, the media and the general public – to show the power these programs have to end hunger.
“Ending hunger lifts us all, and to do that you really need the scope of the safety net and the scale of the safety net,” Berg says. “And that’s the story we really want to use this data to tell.”

RECOMMENDED FOR YOU


NATURE
PLANTING THE SEEDS OF INNOVATION
Crop science meets data science to create a green, sustainable future for growing vegetables.
Curious about SAS and the analytics that empower organizations everywhere?